1.ELK起源ELK起源
1.1ELK是什么?
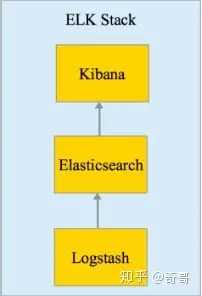
ELK 是elastic公司提供的一套完整的日志收集以及展示的解决方案,是三个产品的首字母缩写,分别是ElasticSearch、Logstash 和 Kibana。

– ElasticSearch简称ES,它是一个实时的分布式搜索和分析引擎,它可以用于全文搜索,结构化搜索以及分析。它是一个建立在全文搜索引擎 Apache Lucene 基础上的搜索引擎,使用 Java 语言编写。
– Logstash是一个具有实时传输能力的数据收集引擎,用来进行数据收集(如:读取文本文件)、解析,并将数据发送给ES。
– Kibana为 Elasticsearch 提供了分析和可视化的 Web 平台。它可以在 Elasticsearch 的索引中查找,交互数据,并生成各种维度表格、图形。
1.2ELK的用途
传统意义上,ELK是作为替代Splunk的一个开源解决方案。Splunk 是日志分析领域的领导者。日志分析并不仅仅包括系统产生的错误日志,异常,也包括业务逻辑,或者任何文本类的分析。而基于日志的分析,能够在其上产生非常多的解决方案,譬如:
- 问题排查。我们常说,运维和开发这一辈子无非就是和问题在战斗,所以这个说起来很朴实的四个字,其实是沉甸甸的。很多公司其实不缺钱,就要稳定,而要稳定,就要运维和开发能够快速的定位问题,甚至防微杜渐,把问题杀死在摇篮里。日志分析技术显然问题排查的基石。基于日志做问题排查,还有一个很帅的技术,叫全链路追踪,比如阿里的eagleeye 或者Google的dapper,也算是日志分析技术里的一种。
- 监控和预警。 日志,监控,预警是相辅相成的。基于日志的监控,预警使得运维有自己的机械战队,大大节省人力以及延长运维的寿命。
- 关联事件。多个数据源产生的日志进行联动分析,通过某种分析算法,就能够解决生活中各个问题。比如金融里的风险欺诈等。这个可以可以应用到无数领域了,取决于你的想象力。
- 数据分析。 这个对于数据分析师,还有算法工程师都是有所裨益的。
场景一
作为一个运维工程师, 某天虚拟机出现故障, 想看看虚拟机是否有异常日志,物理机上是否有异常日志, 管理物理机的云平台/系统是否有发生异常日志, 一个个主机 系统登陆过去, 输入账号密码费时费力,有时还会出现记不住密码干着急的情况,大大影响了排障的效率。 有没有一个系统,能够集中查看和搜索日志,不需要繁琐的登陆, 方便的获取排障所需的重要信息, 有异常还能够订阅?
场景二
作为一个开发人员, 开发的系统经常需要调用外部的api, 每次出现问题需要去查看日志,看是哪个环节出现问题, 是调用第三方api出错,还是连接数据库出错,只能一个一个查。 另外还会遇到的问题是, 有时候无意中grep了一个大的文件,导致iowait冲高,引发不必要的系统异常告警。 有没有一个工具能够提供各种仪表盘,每次打开一个页面就能一目了然的看到调用各个api的情况,调用了多少次, 失败了多少次?
场景三
开发人员上线新版本,上线过程中可能会出现各种问题。 有时不能及时发现会引起哪些异常,对其它系统有哪些影响。有没有一个工具 可以看到和分析上线新版本前后的变化?这样 就能有助于分析相应的故障是否是和上线新版本有关了。
场景四
作为一个团队领导, 团队开发产品已经上线一段时间了, 希望看到产品有多少人访问, 哪个功能访问了多少次,模块的出错率如何,每次都到机器上去跑分析脚本,费时费力,还不直观, 如果产品部署在分布式集群统计起来更是麻烦, 有没有一个系统能以更加简便的方式可以查看到这些情况?
上述的问题,ELK统统可以解决。
日常工作中会面临很多问题,处理问题时候。怎么解决问题?
通过工作经验,迅速判断问题出在哪。
通过日志
– 系统日志:/var/log 目录下的问题的文件
– 程序日志: 代码日志(项目代码输出的日志)
– 服务应用日志
– nginx、HAproxy、lvs
– tomcat、php-fpm
– redis、mysql、mongo
– RabbitMq、kafka
– Glusterfs、HDFS、NFS等等
通过日志排除,发现问题根源解决问题
如果1台或者几台服务器,我们可以通过 linux命令,tail、cat,通过grep、awk等过滤去查询定位日志查问题
但是如果几十台、甚至几百台。通过这种方式肯定不现实。
怎么办?
一些聪明人就提出了建立一套集中式的方法,把不同来源的数据集中整合到一个地方。
一个完整的集中式日志系统,是离不开以下几个主要特点的。
- 收集-能够采集多种来源的日志数据
- 传输-能够稳定的把日志数据传输到中央系统
- 存储-如何存储日志数据
- 分析-可以支持 UI 分析
- 警告-能够提供错误报告,监控机制
市场上的产品
基于上述思路,于是许多产品或方案就应运而生了
简单的 Rsyslog,Syslog-ng
商业化的 Splunk
开源的
– FaceBook 公司的 Scribe,
– Apache 的 Chukwa,
– Linkedin 的 Kafak,
– Cloudera 的 Fluentd,
– ELK
– Splunk是一款非常优秀的产品,但是它是商业产品,价格昂贵,让许多人望而却步.
- Grafana + Prometheus
2.ELK 协议栈介绍及体系结构
ELK其实并不是一款软件,而是一整套解决方案,是三个软件产品的首字母缩写,Elasticsearch,Logstash 和 Kibana。这三款软件都是开源软件,通常是配合使用,而且又先后归于 Elastic.co 公司名下,故被简称为ELK协议栈
Elasticsearch
Elasticsearch 是一个实时的分布式搜索和分析引擎,它可以用于全文搜索,结构化搜索以及分析。它是一个建立在全文搜索引擎 Apache Lucene基础上的搜索引擎,使用Java语言编写
主要特点 实时分析 分布式实时文件存储,并将每一个字段都编入索引 文档导向,所有的对象全部是文档 高可用性,易扩展,支持集群(Cluster)、分片和复制(Shards 和 Replicas)。接口友好,支持 JSON
Logstash
Logstash 是一个具有实时渠道能力的数据收集引擎。使用 JRuby 语言编写。其作者是世界著名的运维工程师乔丹西塞 (JordanSissel)
主要特点
- 几乎可以访问任何数据
- 可以和多种外部应用结合
- 支持弹性扩展
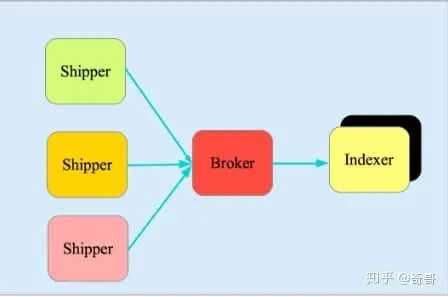
它由三个主要部分组成
- Shipper-发送日志数据
- Broker-收集数据,缺省内置 Redis
- Indexer-数据写入
Kibana
Kibana是一款基于 Apache开源协议,使用 JavaScript语言编写,为 Elasticsearch提供分析和可视化的 Web 平台。它可以在Elasticsearch的索引中查找,交互数据,并生成各种维度的表图.
Filebeat
ELK 协议栈的新成员,一个轻量级开源日志文件数据搜集器,基于 Logstash-Forwarder源代码开发,是对它的替代。在需要采集日志数据的 server 上安装Filebeat,并指定日志目录或日志文件后,Filebeat就能读取数据,迅速发送到Logstash进行解析,亦或直接发送到 Elasticsearch进行集中式存储和分析。
3.ELK 词汇
3.1.集群,节点,分片,副本
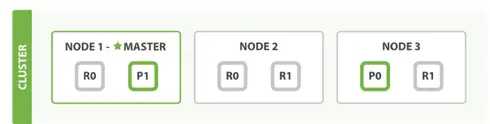
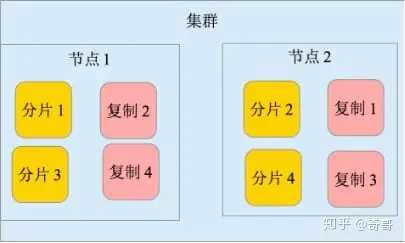
– 上面是一个1个node, 2个replica, 3个shard的结构
– cluster(集群)由多个node(节点)组成
– 数据会被索引,并保存在index里(类比RDBMS里的DB)
– 一个index可以切成多个shard(分片),每个shard可以有多个replica(副本)
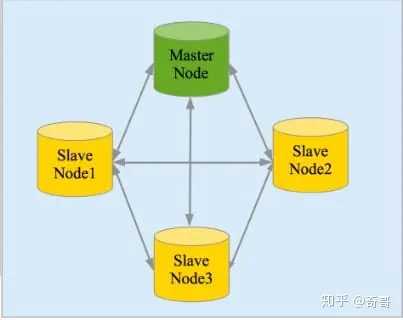
– node分为三种类型, 分别是master node,data node ,client node。 每个cluster会有一个node被选举成master,负责维护cluster state data。
– shard均匀分布在所有可用的data node
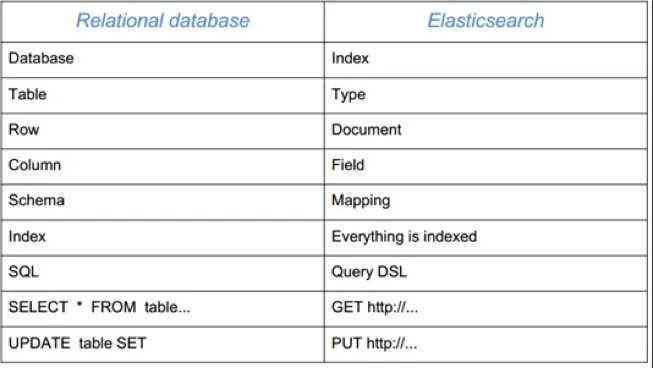
3.2.ES 和 关系型数据库的概念比较
ES本身可以理解为自带搜索引擎的数据库。 有些概念可以和关系型数据库(比如说MySQL) 进行对比。 概念的对比如下表所示:
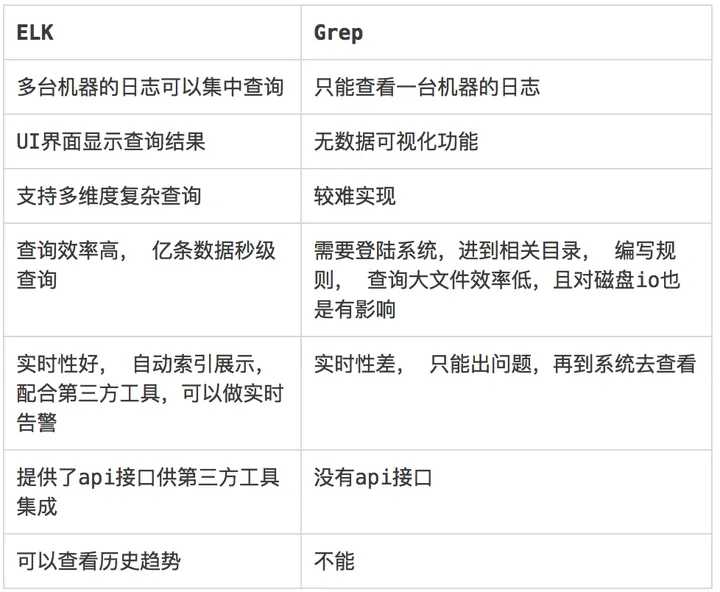
3.3.ELK vs Linux Grep
4.ELK 常用架构
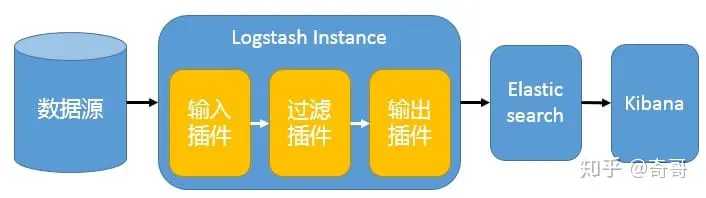
最简单架构
在这种架构中,只有一个 Logstash、Elasticsearch 和 Kibana 实例。Logstash 通过输入插件从多种数据源(比如日志文件、标准输入 Stdin 等)获取数据,再经过滤插件加工数据,然后经 Elasticsearch 输出插件输出到 Elasticsearch,通过 Kibana 展示
Logstash 作为日志搜集器
这种架构是对上面架构的扩展,把一个 Logstash 数据搜集节点扩展到多个,分布于多台机器,将解析好的数据发送到 Elasticsearch server 进行存储,最后在 Kibana 查询、生成日志报表等
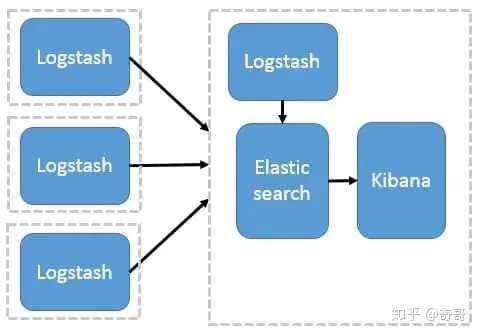
这种结构因为需要在各个服务器上部署 Logstash,而它比较消耗 CPU 和内存资源,所以比较适合计算资源丰富的服务器,否则容易造成服务器性能下降,甚至可能导致无法正常工作。
Beats 作为日志搜集器
这种架构引入 Beats 作为日志搜集器。目前 Beats包括四种:
- Packetbeat(搜集网络流量数据);
- Topbeat(搜集系统、进程和文件系统级别的 CPU 和内存使用情况等数据);
- Filebeat(搜集文件数据);
- Winlogbeat(搜集 Windows 事件日志数据)。
Beats 将搜集到的数据发送到 Logstash,经 Logstash 解析、过滤后,将其发送到 Elasticsearch存储,并由 Kibana 呈现给用户。
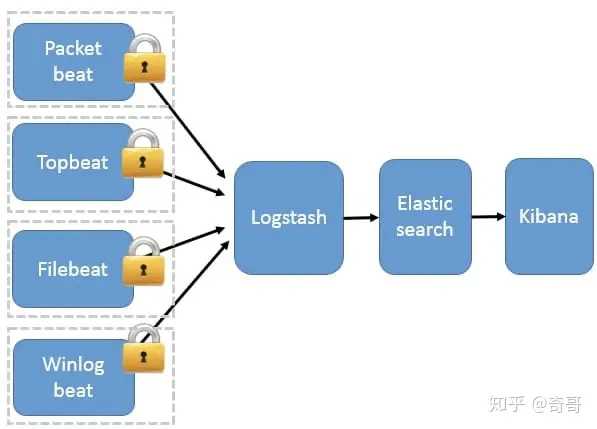
这种架构解决了 Logstash 在各服务器节点上占用系统资源高的问题。相比 Logstash,Beats 所占系统的 CPU 和内存几乎可以忽略不计。另外,Beats 和 Logstash 之间支持 SSL/TLS 加密传输,客户端和服务器双向认证,保证了通信安全。
因此这种架构适合对数据安全性要求较高,同时各服务器性能比较敏感的场景。
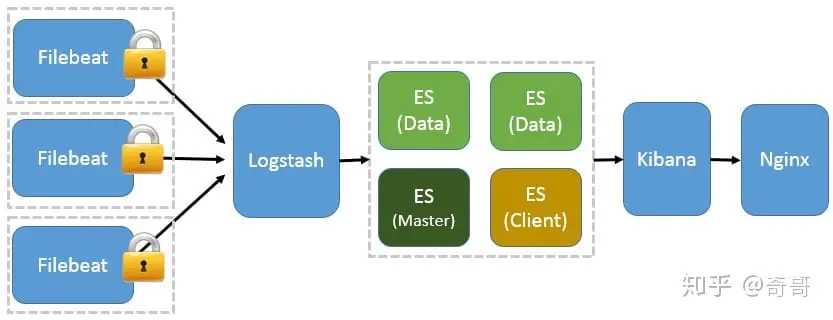
基于Filebeat 架构的配置部署
前面提到 Filebeat 已经完全替代了 Logstash-Forwarder 成为新一代的日志采集器,同时鉴于它轻量、安全等特点,越来越多人开始使用它。这个章节将详细讲解如何部署基于 Filebeat 的 ELK 集中式日志解决方案。
基于 Filebeat 的 ELK 集群架构
引入消息队列机制的架构
Beats 还不支持输出到消息队列,所以在消息队列前后两端只能是 Logstash 实例。这种架构使用 Logstash 从各个数据源搜集数据,然后经消息队列输出插件输出到消息队列中。目前 Logstash 支持 Kafka、Redis、RabbitMQ 等常见消息队列。然后 Logstash 通过消息队列输入插件从队列中获取数据,分析过滤后经输出插件发送到 Elasticsearch,最后通过 Kibana 展示。
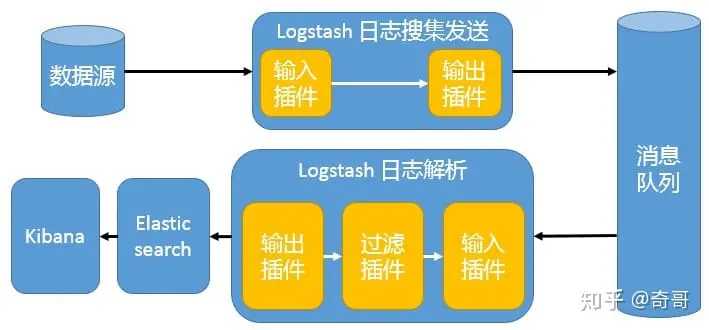
这种架构适合于日志规模比较庞大的情况。但由于 Logstash 日志解析节点和 Elasticsearch 的负荷比较重,可将他们配置为集群模式,以分担负荷。引入消息队列,均衡了网络传输,从而降低了网络闭塞,尤其是丢失数据的可能性,但依然存在 Logstash 占用系统资源过多的问题。
安装配置问题
How to start an existing container and forward the ports?
1.Get the container ID:
docker ps -a
2.Stop the container:
docker stop [container name]
3.Edit the container hostconfig.json file, found at
var/lib/docker/containers/[container ID]/hostconfig.json
4.Within the PortBindings section, either edit the existing HostPort to the port you would like, or add them yourself (see below)
5.Save and exit the config file
6.Restart docker:
sudo systemctl restart docker
7Start up the container:
docker start [container name]
An example config file:
"PortBindings": {
    "3306/tcp": [
        {
            "HostIp": "",
            "HostPort": "23306"
        }
    ],
    "443/tcp": [
        {
            "HostIp": "",
            "HostPort": "2443"
        }
    ],
    "80/tcp": [
        {
            "HostIp": "",
            "HostPort": "80"
        }
    ]
}
How to convert .crt to .pem
sudo openssl x509 -in ./elasticsearch-ca.crt -out ./elasticsearch-ca.pem -outform PEM
ignore the host limit
echo "network.bind_host: 0" >> ./usr/share/elasticsearch/config/elasticsearch.yml
check the ports listening
sudo lsof -nP -iTCP -sTCP:LISTEN
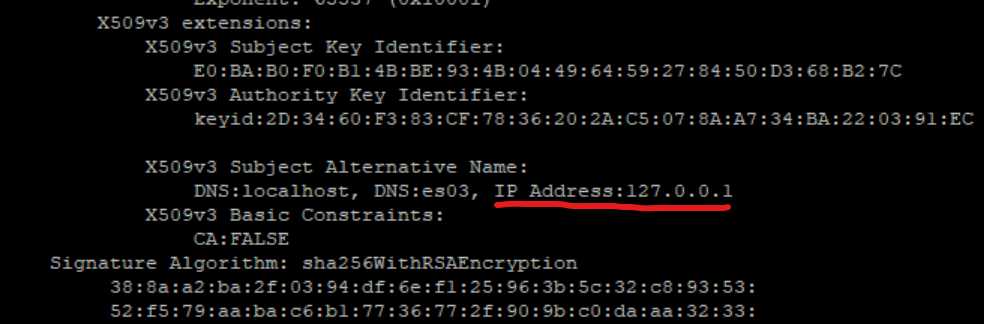
Cerificate error
2024-03-12T19:49:02.982Z        ERROR   [esclientleg]   transport/logging.go:37 Error dialing x509: certificate is valid for 127.0.0.1, not 192.168.132.199  p", "address": "192.168.132.199:9200"}
2024-03-12T19:49:02.983Z        ERROR   [esclientleg]   eslegclient/connection.go:232   error connecting to Elasticsearch at https://192.168.132.199:9200: Ge.132.199:9200": x509: certificate is valid for 127.0.0.1, not 192.168.132.199
2024-03-12T19:49:02.983Z        ERROR   instance/beat.go:1027   Exiting: couldn't connect to any of the configured Elasticsearch hosts. Errors: [error connecrch at https://192.168.132.199:9200: Get "https://192.168.132.199:9200": x509: certificate is valid for 127.0.0.1, not 192.168.132.199]
Exiting: couldn't connect to any of the configured Elasticsearch hosts. Errors: [error connecting to Elasticsearch at https://192.168.132.199:9200: Get "http9:9200": x509: certificate is valid for 127.0.0.1, not 192.168.132.199]
Reference: https://www.elastic.co/guide/en/elasticsearch/reference/current/certutil.html
https://www.elastic.co/guide/en/elasticsearch/reference/current/update-node-certs-same.html
Check the certificate bundle IPs
sudo docker exec -u 0 -i -t 001-elkmonitoring-es03-1 bash

cd /usr/share/elasticsearch/config/
certs
elasticsearch-plugins.example.yml
elasticsearch.keystore
elasticsearch.yml
jvm.options
jvm.options.d
log4j2.file.properties
log4j2.properties
role_mapping.yml
roles.yml
users
users_roles
cd certs

ca
ca.zip
certs.zip
es01
es02
es03
instances.yml
cat instances.yml
instances:
   - name: es01
     dns:
       - es01
       - localhost
     ip:
       - 127.0.0.1
   - name: es02
     dns:
       - es02
       - localhost
     ip:
       - 127.0.0.1
   - name: es03
     dns:
       - es03
       - localhost
     ip:
       - 127.0.0.1
cd ca
ca.crt  ca.key

cd es03

es03.crt es03.key
openssl x509 -in ca.crt -text -noout
add actual IP address into docker-compose.yaml
vi docker-compose.yaml
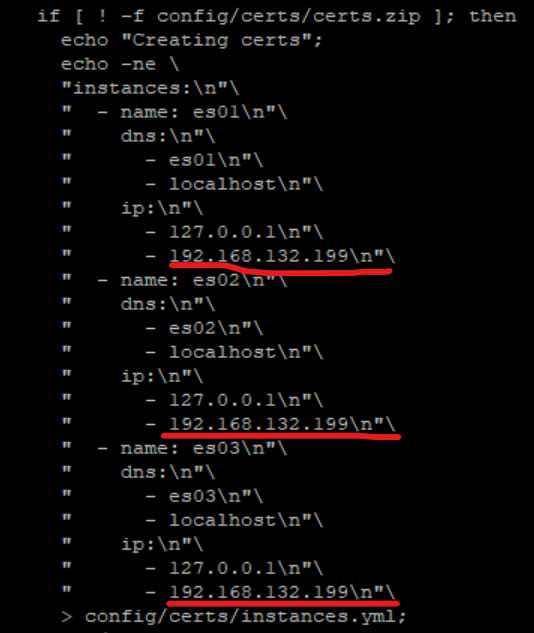
remove and recreate elasticsearch dockers:
docker-compose down -v
sudo docker-compose up -d
get the certificate again:
sudo docker exec -it 001-elkmonitoring-es03-1 openssl x509 -fingerprint -sha256 -in /usr/share/elasticsearch/config/certs/ca/ca.crt
copy the certificate included the lines of “—–BEGIN CERTIFICATE—–” and “—–END CERTIFICATE—–”
pasted into client host: /usr/local/share/ca-certificates/metric/elasticsearch-ca.crt
generate PEM file
sudo openssl x509 -in ./elasticsearch-ca.crt -out ./elasticsearch-ca.pem -outform PEM
make sure in /etc/metricbeat/metricbeat.yml
ssl.certificate_authorities: ["/usr/local/share/ca-certificates/metric/elasticsearch-ca.pem"]
Start up metricbeat, make sure there is no error:
sudo metricbeat setup -e
How to create security certificate pem for elasticsearch an kibana?
The following commands will get you the certs for Elastic. Make sure the cert is in the right folder /etc/elasticsearch and has the correct permissions. I am not sure if 644 is the right one it it can be made tighter but I left it at that
/usr/share/elasticsearch/bin/elasticsearch-certutil ca
/usr/share/elasticsearch/bin/elasticsearch-certutil cert --ca elastic-stack-ca.p12
chmod 644 elastic-certificates.p12
Then your ElasticSearch.yml should look like this:
xpack.security.enabled: true
xpack.security.transport.ssl.enabled: true
xpack.security.transport.ssl.verification_mode: certificate
xpack.security.transport.ssl.keystore.path: elastic-certificates.p12
xpack.security.transport.ssl.truststore.path: elastic-certificates.p12
xpack.security.http.ssl.enabled: true
xpack.security.http.ssl.keystore.path: elastic-certificates.p12
xpack.security.http.ssl.truststore.path: elastic-certificates.p12
Then you run that OpenSSL Command inside /etc/kibana and you will get a key/cert file. Then put these settings in your kibana file
server.ssl.enabled: true
server.ssl.certificate: /etc/kibana/cert.pem
server.ssl.key: /etc/kibana/key.pem
server.ssl.keyPassphrase: xxxxxxx
Make sure you put this in the kibana.yml if you have self signed certs
elasticsearch.ssl.verificationMode: none
Now if you have enabled authentication you can autogen the passwords using this command and use them in the kibana file
/usr/share/elasticsearch/bin/elasticsearch-setup-passwords auto
How to fix Kibana not started up?
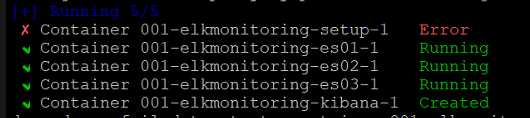
check the container logs:
sudo docker logs 001-elkmonitoring-kibana-1

 FATAL  Error: [config validation of [elasticsearch].password]: expected value of type [string] but got [number]