1.ASMM简介
ASMM是Oracle 10g提供内存管理方式。使用ASMM,不再需要手工设置shared pool、buffer pool等若干内存池的大小,只需要为SGA设置一个总的大小即可。Oracle的MMAN进程(Memory Manager Process,内存管理进程)会根据系统负载的变化和内存需求,自动调整SGA中各个内存池的大小。
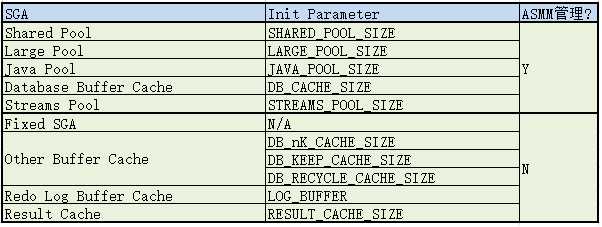
SGA中包含内存区及对应参数如下:
2.配置ASMM
sga_target参数定义了SGA的总容量。同时,初始化参数statistics_level必须设置为typical或all才能启动ASMM,否则如果设置为basic,则关闭ASMM。
Eanble ASMM:
- Set the SGA_TARGET(dynamic parameter) initialization parameter to a nonzero value.
- Set the STATISTICS_LEVEL initialization parameter to TYPICAL or ALL.
You must set statistics_level to TYPICAL (default) or ALL to use Automatic Shared Memory Management.
Disable ASMM:
- set SGA_TARGET to 0 at instance startup, ASMM will be disabled and the current auto-tuned sizes will be used for each memory pool.
- If necessary, you can manually resize each memory pool using the DB_CACHE_SIZE, SHARED_POOL_SIZE, LARGE_POOL_SIZE, JAVA_POOL_SIZE, and STREAMS_POOL_SIZE initialization parameters.
The following pools are not affected by Automatic Shared Memory Management:
- Log buffer – LOG_BUFFER
- Other buffer caches, such as KEEP, RECYCLE, and other block sizes – DB_KEEP_CACHE_SIZE, DB_RECYCLE_CACHE_SIZE, DB_nK_CACHE_SIZE
- Fixed SGA and other internal allocations
To manually size these memory pools, you need to set the DB_KEEP_CACHE_SIZE, DB_RECYCLE_CACHE_SIZE, DB_nK_CACHE_SIZE, and LOG_BUFFER initialization parameters. The memory allocated to these pools is deducted from the total available for SGA_TARGET when Automatic Shared Memory Management computes the values of the automatically tuned memory pools.
ASMM只能自动调整5个内存池的大小:
1. shared pool
2. buffer cache
3. large pool
4. java pool
5. stream pool
使用ASMM,不再需要设置相应的5个初始化参数。
其它内存池,比如log buffer、keep buffer cache 等仍然需要DBA手工进行调整。
另外,sga_target的值不能超过sga_max_size的值,修改 sga_max_size时,必须重启实例才能生效,而 sga_target则可以在线修改,立即生效,无须重启实例。
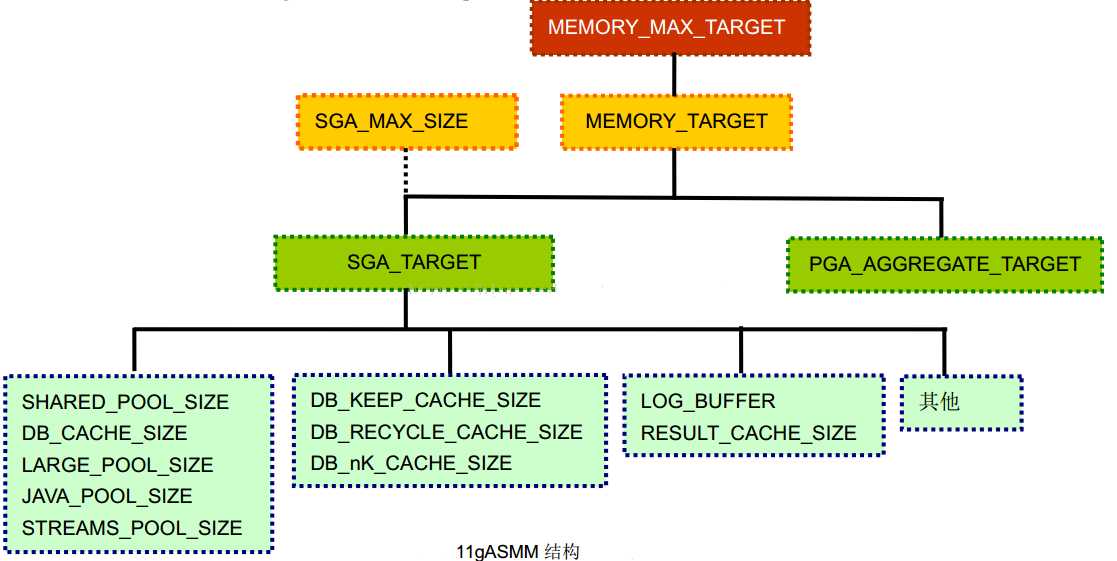
在Oracle11g数据库中,使用自动内存管理特性不再需要设定参数SGA_TARGET和PGA_AGGREGATE_TARGET,因为这两个参数都已经被修改成自动调优的,除非想指定PGA和 SGA 的最小值才需要设定这两个参数。
在Oracle11g数据库中,需要设置一个叫做MEMORY_TARGET的初始化参数,这个参数是指整个Oracle实例所能使用的内存大小,包括PGA和SGA的整体大小,在MEMORY_TARGET的内存大小之内,PGA和 SGA所用的内存可以根据当前负载情况自动相互转换。
如果当初始设定的MEMORY_TARGET的内存不够当前数据库使用的时候,Oracle11g
还提供了另外一个初始化参数MEMORY_MAX_TARGET,当原始设定的内存不够使用的时候,可以手工来动态调节 MEMORY_TARGET 的大小,但是不允许超过MEMORY_MAX_TARGET 的值。
memory_max_target表示oracle实例启动以后可以从操作系统上所获得的最大内存,一般是操作系统physical memory*80% 分配给oracle使用。比如物理内存是8G,最少给memory_max_target分配6G左右。
memory_target表示当前实例分配的内存,memory_target<=memory_max_target
OLTP:以事务操作为主,比如银行,存钱,取钱,转账。在这种类型的数据库里SGA占80%,PGA占20% 。PGA的空间大部分用于数据的排序,OLTP类型的数据库一般访问的数据量不会特别大,排序也不会特别多,所以给PGA的内存不会特别多。希望执行的SQL和访问的数据块都可以被共享,所以SGA占80%。
OLAP(DSS):以海量的查询为主,会牵扯到大量表的连接,数据统计分析汇总,在SQL执行的过程当中访问的数据量都比较大,执行的时间都比较长,会涉及到大量的排序工作,因为访问的数据量大,访问的数据块在内存里很难被共享,执行的SQL也很难做到共享,所以SGA 40%,PGA 60%
由于银行等很多系统,白天可能是OLTP系统,到了晚上是OLAP系统,那么手工方式管理SGA和PGA的内存分配就很麻烦了,在11G之前内存是不能自动管理的,必须手动调整PGA和SGA的大小,在11G增加了memory_max_target,memory_target两个参数。
3. Views on Dynamic SGA
- V$SGA_CURRENT_RESIZE_OPS: SGA resize operations that are currently in progress
- V$SGA_RESIZE_OPS: Information about the last 400 completed SGA resize operations
- V$SGA_DYNAMIC_COMPONENTS: Information about the dynamic components of the SGA
- V$SGA_DYNAMIC_FREE_MEMORY: Information about the amount of SGA memory available for future dynamic SGA resize operations
4. MMAN(Memory Manager)进程
MMAN dynamically adjust the sizes of the SGA components like buffer cache, large pool, shared pool and java pool and serves as SGA memory broker.
It is a new process added to Oracle 10g as part of automatic shared memory management.
每隔很短的一段时间,MMAN进程会周期地启动,查询Oracle SGA内存组件,比如有 buffer cache顾问,也有 shared pool顾问,由这些顾问根据当前的负载情况,将这 5个可以自动调整的内存池的、建议的大小尺寸,返回给 MMAN。于是,MMAN进程就会根据该返回的值,来设置各个内存池。同时,如果我们使用了 spfile,还会将这些顾问得出的建议值写入spfile 里。这样,下次启动实例时,就可以直接把顾问得出的建议值拿来作为启动内存池的依据了。
如果启用了ASMM,同时又手工设置了可以自动调整大小的内存池的尺寸,比如设置了参数shared_pool_size为一个非0值的时候,会怎么样?为自动调整大小的内存组件设置了值,则会以设置的值作为自动调整的最小值。也就是说,假设sga_target为4GB,而将shared_pool_size设置为600MB,则MMAN在进行自动调整时,永远不会将shared pool设置为600MB以下。
立即内存申请(Immediate Request):这种申请模式一般出现在ASMM管理的某个自动调优组件在无法分配到连续可用内存块(chunk)时,为了避免出现OUT-OF-MEMORY(ORA-04031)的错误,系统尝试从其他候选组件中转移一个内存颗粒(granule)过来。需要注意的是当前可能没有可用的全空granule,这时就会出现不完整的转移,在此情形下系统会开始从候选组件中清理内存颗粒以满足内存申请,并将一个granule不完整地转移给急需内存的组件。
手动内存申请(Manual Request):这种申请仅发生在用户使用alter system命令手动调整内存组件的大小时。在这种模式下仅允许使用空的内存颗粒参与大小调整。如果当时没有足够的空granule,那么针对组件grow操作会返回ORA-4033错误,而针对组件shrink操作会返回ORA-4034错误。
当ASMM被启用后,内存代理(Memory Broker)定期执行上图所示的活动。以上操作都处于延迟内存申请模式下(Deferred)。其目的是通过自动化的作业来调优自动调优组件(auto-tunable component)的大小以适应不断改变的工作负载,将内存分配到最需要它们的地方。MMON辅助进程会在后台不断将统计信息和内存建议定期地捕获到循环使用的内存中,并计算不同时期缓存信息之间的差值;MMON还会基于Memory Broker的策略分析这些差值并估算出长期和短期内的趋势。最后MMON基于以上分析生成一些内存组件的大小调整决议并将相应的申请发送到一个系统申请队列中(resize request system queue)。MMAN后台进程(Memory Manager is a background process that manages the dynamic resizing of SGA memory areas as the workload increases or decreases)会定期扫描系统申请队列并执行内存转移。
The Automatic Shared Memory Management feature uses background process named Memory Manager (MMAN).MMAN serves as the SGA Memory Broker and coordinates the sizing of the memory components. The SGA Memory Broker keeps track of the sizes of the components and pending resize operations.There is not so many document on this process but here is some help:
Let’s see what is MMAN responsible for :
SQL> select substr(DEST,1,10) DEST, DESCRIPTION from x$messages where DEST=’MMAN’;

DEST       DESCRIPTION
---------  --------------------
MMAN lock memory at startup
MMAN lock memory timeout action
MMAN Memory Management
MMAN Complete deferred initialization of components
MMAN Handle sga_target resize
MMAN Handle mem_target resize
MMAN Handle sga_target deferred request delete
MMAN Reset advisory pool when advisory turned ON
The SGA Memory Broker keeps track of the sizes of the components and pending resize operations.
We can dump memory broker statistics into trace file using
oradebug dump DUMP_ADV_SNAPSHOTS command e.g.
SQL> oradebug setmypid
SQL> oradebug dump DUMP_ADV_SNAPSHOTS 0
Default value for memory broker statistis is 30 sec.It is controled by underscore parameter
_memory_broker_stat_interval 30 memory broker statistics gathering interval for auto sga
and can be changed with alter system command e.g.
alter system set “_memory_broker_stat_interval”=60 scope=both sid='demo';
will change gathering interval to one minute.
New snapshot will be generated after _memory_broker_stat_interval expires.
Trace file has various statistics for diffrent SGA components.Note snapshots numbers and timestamp.
Processing Oradebug command ‘dump DUMP_ADV_SNAPSHOTS 0′
Dumping memory broker statistics snapshots 5677
0: ----------------------------------------------------------
Stats Entry #5646 taken at timestamp 671200759
Stat Value
-------------------------------------------------------------
DB time 355973
DEFAULT cache read count 33608
DEFAULT cache read time 227
shared pool load count 24336
shared pool load time 53486
java pool load count 422
java pool load time 11
shared io pool wait time 0
Component Granules
--------------------------------------------------------------
DEFAULT cache 70
Shared Pool 33
Large Pool 1
Java Pool 2
SGA Target 107
PGA Target 72
Default Cache Advice Version=12 Start Index of Version=9
Default Cache Granules -> Estimated Read Time
--------------------------------------------------------------
--------------------------------------------------------------
7 -> 364, 14 -> 275, 21 -> 235, 28 -> 227, 35 -> 227, 42 -> 227, 49 -> 227, 56 -> 227, 63 -> 227, 70 -> 227, 77 -> 227, 84 -> 227, 91 -> 227, 98
-> 227, 105 -> 227, 112 -> 227, 119 -> 227, 126 -> 227, 133 -> 227, 140 -> 227
Shared Pool Advice Version=16 Start Index of Version=9
Shared Pool Granules -> Estimated Load Time
--------------------------------------------------------------
25 -> 3590, 29 -> 1856, 33 -> 195, 37 -> 1, 41 -> 1, 45 -> 1, 49 -> 1, 53 -> 1, 57 -> 1, 61 -> 1, 65 -> 1, 69 -> 1
Java Pool Advice Version=2 Start Index of Version=20
Java Pool Granules -> Estimated Load Time
--------------------------------------------------------------
1 -> 195, 2 -> 195, 3 -> 195, 4 -> 195
PGA Target Advice Version=1 Start Index of Version=0
PGA Granules -> Estimated PGA Processing Time
--------------------------------------------------------------
9 -> 11962649, 18 -> 11886641, 36 -> 11886641, 54 -> 11886641, 72 -> 11886641, 86 -> 11886641, 100 -> 11886641, 115 -> 11886641, 129 -> 11886641,
144 -> 11886641, 216 -> 11886641, 288 -> 11886641, 432 -> 11886641, 576 -> 11886641
---------------------------------------------------------------
1: ------------------------------------------------------------
Stats Entry #5677 taken at timestamp 671202561
5.AMM内存调优
SQL>  select * from v$memory_target_advice order by memory_size;

MEMORY_SIZE MEMORY_SIZE_FACTOR ESTD_DB_TIME ESTD_DB_TIME_FACTOR    VERSION
----------- ------------------ ------------ ------------------- ----------     180         .5                 458          1.344               0
270         .75                367          1.0761              0
360         1                  341          1                   0
450         1.25               335          .9817               0
540         1.5                335          .9817               0
630         1.75               335          .9817               0
720         2                  335          .9817               0
当MEMORY_SIZE_FACTOR为1时MEMORY_SIZE的值,即一般认为比较合理的MEMORY_TARGET的值。
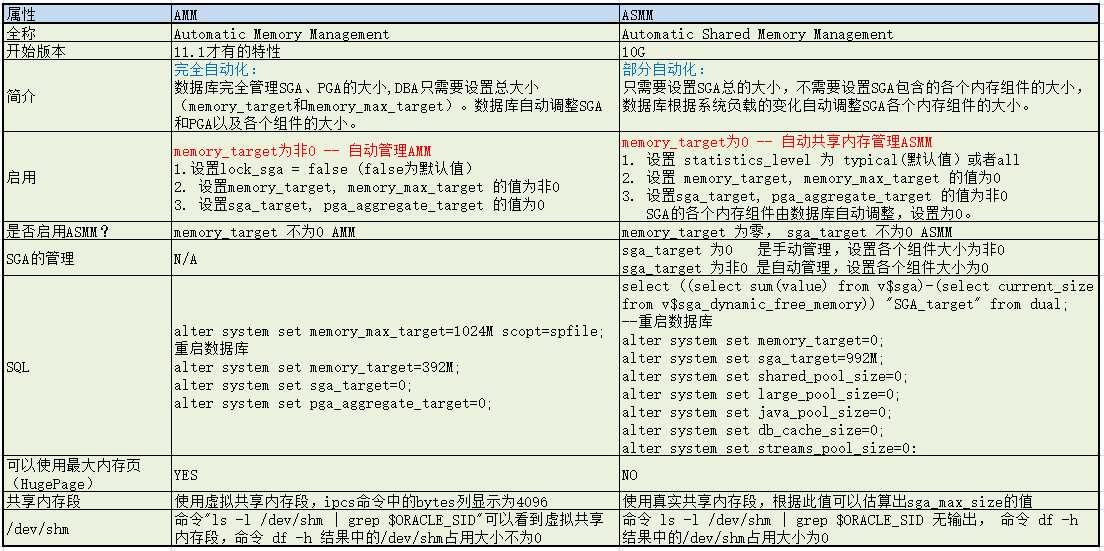
6.AMM和ASMM的区别
设置ASMM的时候,可能会出现以下错误:
ORA-00843: Parameter not taking MEMORY_MAX_TARGET into account
ORA-00849: SGA_TARGET 1677721600 cannot be set to more than MEMORY_MAX_TARGET 0
原因是Oracle启动过程中对于参数的内部检查, MEMORY_MAX_TARGET 的值是0,与SGA_TARGET赋值不为0。SGA_TARGET > MEMORY_MAX_TARGET
创建出pfile,将赋值为0的MEMORY_TARGET和MEMORY_MAX_TARGET记录行删除,使用pfile启动数据库,重建spfile。
7.AMM Limitation
Form: https://blog.dbi-services.com/12cr2-dbca-automatic-memory-management-and-databasetype/
By Franck PachotApril 3, 2017Database Administration & Monitoring, Database management
[DBT-11211] The Automatic Memory Management option is not allowed when the total physical memory is greater than 4GB.
[INS-35178] The Automatic Memory Management option is not allowed when the total physical memory is greater than 4GB.
Automatic Shared Memory Management, or ASMM is what you do when setting SGA_TARGET and not setting MEMORY_TARGET. Basically, you define the size of the SGA you want to allocate at startup and that will be available for the instance, most of it being buffer cache and shared pool. Then, in addition to this shared area used by all instance processes, each processes can allocate private memory, and you control this with PGA_AGGREGATE_TARGET.
The total size of SGA and PGA for all instances in a system must reside in physical memory for the simple reason that they are mostly used to avoid I/O (a large buffer cache avoids physical reads and optimizes physical writes, a large PGA avoids reads and writes to tempfiles).
Because you don’t always know how much to allocate to each (SGA and PGA) Oracle came with a feature where you define the whole MEMORY_TARGET, part of this will be dynamically allocated to SGA or PGA. This is called Automatic Memory Management (AMM). It’s a good idea on the paper: it is automatic, which means that you don’t have to think about it, and it is dynamic, which means that you don’t waste physical memory because of bad sizing.
But it is actually a bad idea when going to implementation, at least on the most common platforms.
SGA and PGA are different beasts that should not be put in the same cage:
- SGA is big, static, shared, allocated once at startup
- PGA is small chunks constantly allocated and deallocated, private to processes
First, it is not so easy because you have to size the /dev/shm correctly or you will get the following at startup:
ORA-00845: MEMORY_TARGET not supported on this system
In addition to that, because the whole memory is prepared to contain the whole SGA you see misleading numbers in ‘show sga’.
Second there are lot of bugs, resizing overhead, etc.
And finally, you cannot use large pages when you are in AMM, and in modern system (lot of RAM, lot of processes) having all processes mapping the SGA with small pages of 4k is a big overhead.
So, as long as you have more than few GB on a system, you should avoid AMM and set SGA_TARGET and PGA_AGGREGATE_TARGET independently. Forget MEMORY_TARGET. Forget /dev/shm. Forget also the following documentation at http://docs.oracle.com/database/122/ADMIN/managing-memory.htm#ADMIN00207 which mentions that Oracle recommends that you enable the method known as automatic memory management.
Actually, AMM is not recommended for systems with more than a few GB of physical memory, and most system have more than few GB of physical memory. If you try to use AMM on a system with more than 4GB you get a warning in 12cR1 and it is an error in 12cR2: DBT-11211 or INS-35178
This does not depend on the size of MEMORY_TARGET you choose, or the size of /dev/shm, but only the size of available physical memory:
[oracle@VM104 ~]df -h /dev/shm
Filesystem      Size  Used Avail Use% Mounted on
tmpfs           3.9G     0  3.9G   0% /dev/shm

[oracle@VM104 ~] free -h
              total        used        free      shared  buff/cache   available
Mem:           7.8G        755M        5.0G        776M        2.1G        6.2G
Swap:          411M          0B        411M
No choice: it is a hard stop
If you are not convinced, then please have a look at MOS Doc ID 2244817.1 which explains this decision:
- It is not something new: DBCA used to give similar warning message but in 12.2.0.1 it is an error message
- Reason behind: Because database creation fails some times and in some cases database wont be functional after some times
So, do you want to create a database which may not be functional after some times?
So, what size for SGA and PGA?
Then, if you were thinking that AMM was cool, your next question not is: what size to allocate to SGA and PGA?
You are in this situation because you have several GB of RAM. Current servers have lot of memory. You don’t have to size it to the near 100MB. Start with some values, run with it. Look at the performance and the memory advisors. Are you doing too much physical I/O on tables where you expect data to be in cache? Then increase the SGA, and maybe set a minimum for the buffer cache. Do you see lot of hard parse because your application runs lot of statements and procedures? Then increase the SGA and maybe set a minimum for the shared pool. Do you run lot of analytic queries that full scan tables and have to hash and sort huge amount of data? Then decrease the SGA and increase the PGA_AGGREGATE_TARGET.
Where to start?
If you don’t know where to start, look at the DBCA database types:
#-----------------------------------------------------------------------------
# Name          : databaseType
# Datatype      : String
# Description   : used for memory distribution when memoryPercentage specified
# Valid values  : MULTIPURPOSE|DATA_WAREHOUSING|OLTP
# Default value : MULTIPURPOSE
# Mandatory     : NO
#-----------------------------------------------------------------------------
Those types define the ratio between SGA and PGA. Then why not start with what is recommended by Oracle?
I’ve created the 3 types of instances with the following:
dbca -silent -totalMemory 10000 -databaseType MULTIPURPOSE -generateScripts -scriptDest /tmp/MULT  ...
dbca -silent -totalMemory 10000 -databaseType DATA_WAREHOUSING -generateScripts -scriptDest /tmp/DWHG  ...
dbca -silent -totalMemory 10000 -databaseType OLTP -generateScripts -scriptDest /tmp/OLTP ...
And here are the settings generated by DBCA
$ grep target /tmp/*/init.ora
DWHG/init.ora:sga_target=6000m
DWHG/init.ora:pga_aggregate_target=4000m
MULT/init.ora:sga_target=7500m
MMULT/init.ora:pga_aggregate_target=2500m
OLTP/init.ora:sga_target=8000m
OLTP/init.ora:pga_aggregate_target=2000m
Here is the summary:
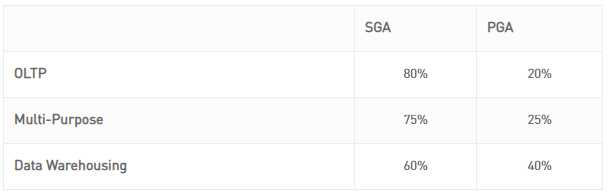
(percentages are relative to eachother, here. Donc’ use 100% of physical memory for the Oracle instances because the system needs some memory as well)
This gives an idea where to start. Servers have lot of memory but you don’t have to use all of it. If you have a doubt, leave some free memory to be available for the filesystem cache. Usually, we recommend to used direct i/o (filesystemio_options=setall) to avoid the filesystem overhead. But when you start and want to lower the risks sub-sizing SGA or PGA, then you may prefer to keep that second level of cache (filesystemio_options=async) which uses all the physical memory available. This may improve the reads from tempfiles in case your PGA is too small. This is just an idea, not a recommendation.
So what?
If you have a server with more than few GB, then set SGA and PGA separately. Start with the ratios above, and then monitor performance and advisors. Physical servers today have at least 32GB. Even with a small VM with 1GB for my labs, I prefer to set them separately, because in that case I want to be sure to have a minimum size for buffer cache and shared pool. You may have lot of small VMs with 3GB and think about setting MEMORY_TARGET. But using large pages is a recommendation here because the hypervisor will have lot of memory to map, so ASMM is still the recommandation.
Once you know the size of all SGA, look at Hugepagesize in /proc/meminfo, set the number of hugepages in /etc/sysctl.conf, run sysctl -p and your instances will use available large pages for the SGA.